Lead Time & Lead Time Determinants
- In ACLIPS, lead time is modeled as a probability distribution, characterized by key parameters such as minimum, mode, average, variance, and percentiles. Unlike symmetrical distributions, lead times are typically right-skewed—delays are more common than unusually short durations. This skewness affects customer service levels and delivery reliability, making it essential for management to consider variability and uncertainty to uphold high service standards.
- Lead time emerges from the dynamic interplay between demand (load) and resources (capacity). Influencing factors include demand characteristics (volume and timing), capacity constraints (processing time, setup time, resource availability), and amplifiers such as variability, randomness, and system complexity. Managerial decisions—such as lot sizing, sequencing, and release strategies—also shape lead time behavior.
- Utilization is a critical factor: as it approaches capacity limits, lead times increase non-linearly. Effective utilization must account not only for processing times but also for unavoidable losses like maintenance and shift changes. Random fluctuations in both demand and capacity further magnify delays, underscoring the need for detailed understanding and planning. Higher variability leads to longer lead times, even when averages remain stable.
- Operational variability stems from events like machine breakdowns, rework, scrap, and setup times, all of which inflate effective utilization and degrade lead time performance. Additional amplifiers such as product mix variation (heterogeneity) and process complexity contribute to issues like shifting bottlenecks in manufacturing systems.
- Management strategies play a pivotal role. Decisions regarding lot sizes, transfer batching, sequencing rules, and release policies significantly affect lead times. Both process and transfer batching exhibit convex relationships with lead time, requiring careful optimization. Poor sequencing and overloaded release mechanisms can further exacerbate inefficiencies.
- Ultimately, improving lead time performance and system efficiency requires proactive management of variability, its amplifiers, and strategic control interventions.
Important Determinants of Lead Time
- Demand Volume (Quantity)
- Demand Timing (Frequency)
- Capacity & Resource Availability
- Setup & Process Time
- # Machines/Workcenters
- Shift Patterns
- Stochasticity & Variability
- Complexity
- Lotsizing
- Sequencing
- Release Mechanism
- Management Strategies
.png "Typical Lead Time Distribution")
Lead Time Distribution
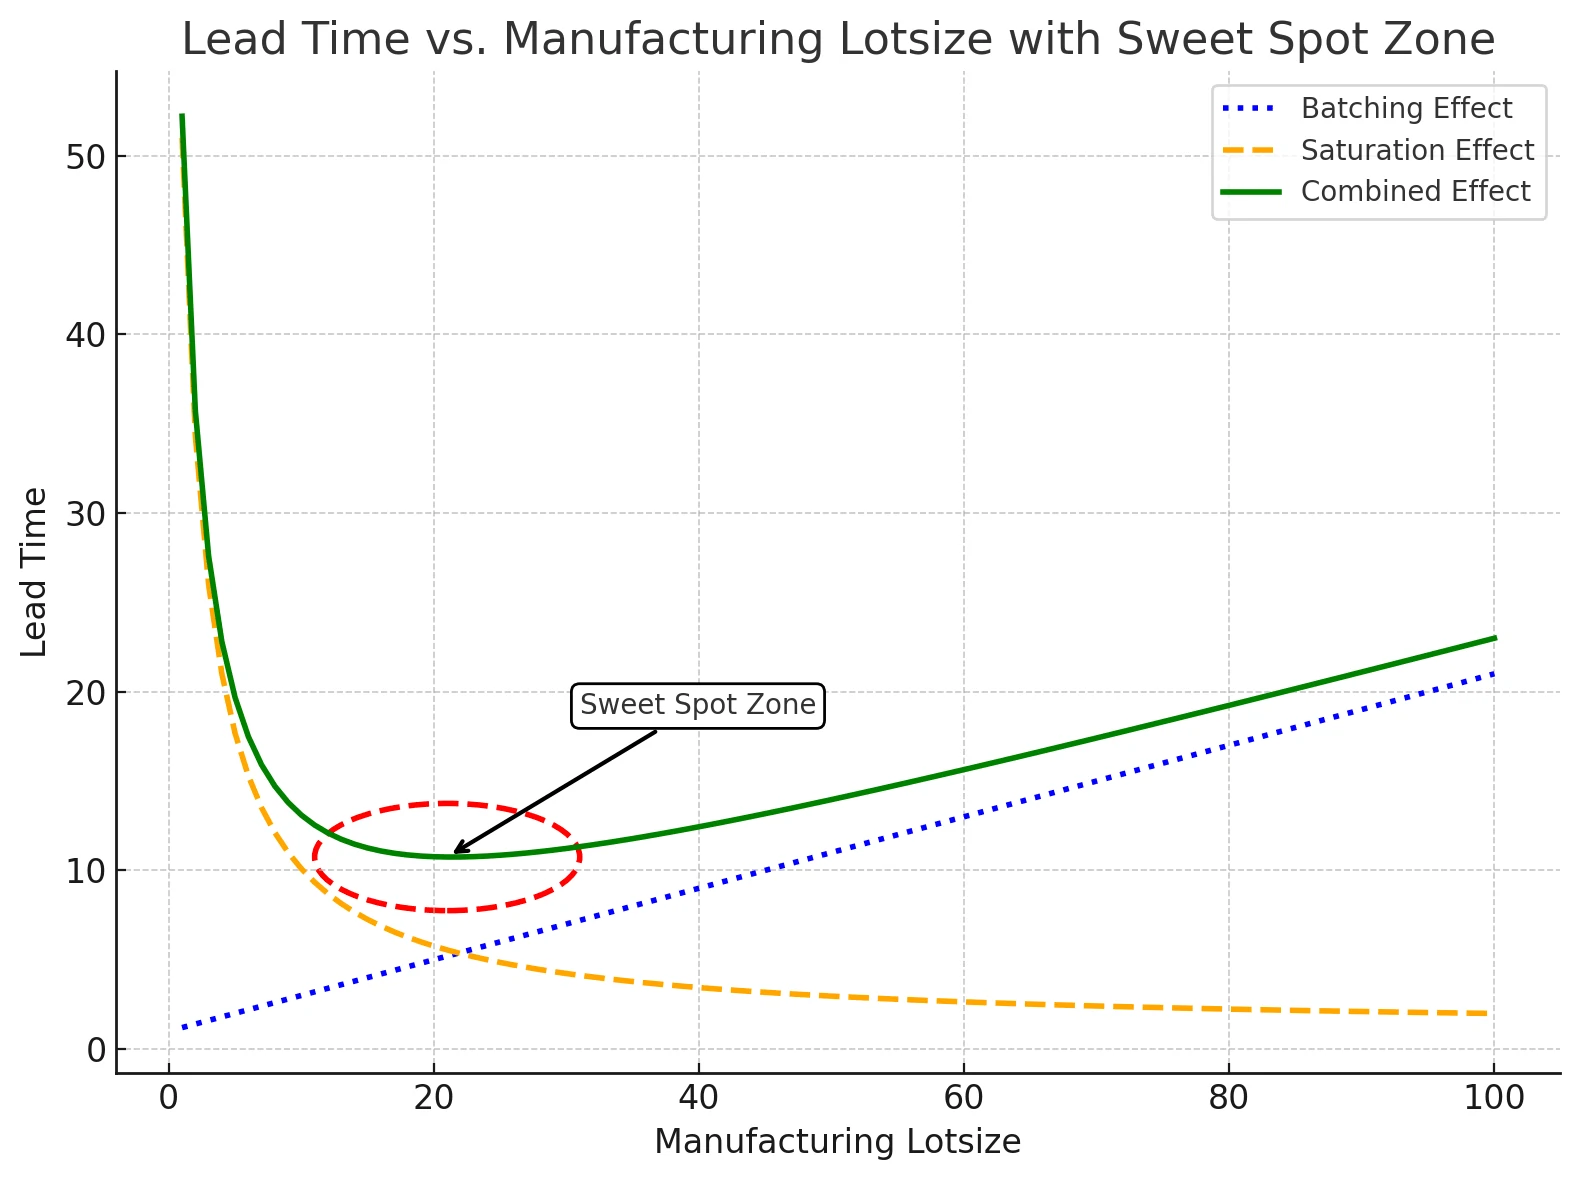
Batching EffectThe batching effect refers to the increase in lead time as manufacturing lot size increases. When items are processed in larger batches, each item must wait until the entire batch is completed before moving to the next stage. This delay accumulates across production stages, resulting in a linear or near-linear increase in lead time with batch size.Key characteristic: Larger lot sizes → longer waiting times → longer lead time.Dominant at: High lot sizes.
Saturation EffectThe saturation effect occurs when lot sizes become very small, leading to excessive setup activities. Because each small batch requires its own setup time, the system becomes overloaded with setups, leaving insufficient time for actual processing. As a result, lead time increases sharply at small lot sizes.Key characteristic: Smaller lot sizes → more frequent setups → system saturation → longer lead time.Dominant at: Very low lot sizes. Together, these two effects produce a U-shaped lead time curve where both very small and very large lot sizes are inefficient, and an intermediate "sweet spot" minimizes lead time.
Saturation EffectThe saturation effect occurs when lot sizes become very small, leading to excessive setup activities. Because each small batch requires its own setup time, the system becomes overloaded with setups, leaving insufficient time for actual processing. As a result, lead time increases sharply at small lot sizes.Key characteristic: Smaller lot sizes → more frequent setups → system saturation → longer lead time.Dominant at: Very low lot sizes. Together, these two effects produce a U-shaped lead time curve where both very small and very large lot sizes are inefficient, and an intermediate "sweet spot" minimizes lead time.